As part of application analytics, the Social interaction dashboard provides a high-level overview of user engagement on the platform, combining hero metrics with a visual breakdown of user interactions over time and other table widgets.
Key components
Hero metrics
Gives a quick overview of key engagement actions performed by users on the platform during the selected period. These are summary statistics displayed for the top-level activity at a glance.
Reactions
- Total count of user reactions (likes, emoticons, etc.) to posts, comments and replies
Feed posts and comments
- Total number of posts and comments added to the platform feed
Replies
- Number of responses or direct replies to posts or comments
Shares
- How many times content has been shared by users
Favorites
- Number of times content was marked as a favorite
Active social campaigns
- Number of active social campaigns over the selected time period
Participant engagement activity dashboard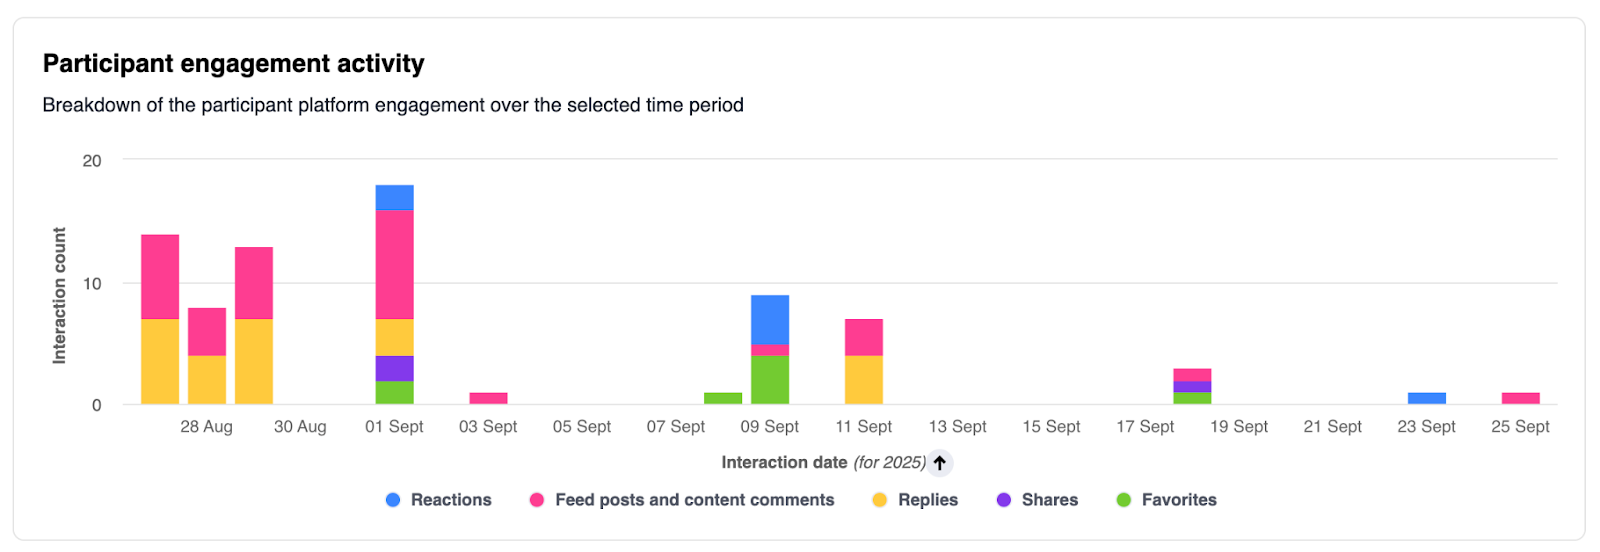
This dashboard presents a breakdown of platform engagement activity by users over the selected time period, visualized in a stacked bar chart. Each bar shows counts of different types of interactions on specific days.
- Stacked bar chart: Visualizes daily engagement broken down by interaction type: reactions, feed posts and comments, replies, shares, and favorites.
- Legend: Colors and labels clearly separate each interaction category.
Insights and interpretation
- Identify when engagement is highest and lowest to assess participation cycles.
- Analyze which interaction types drive the most user activity.
- Use daily breakdowns to correlate engagement with specific events, content releases, or communications.
Most engaged by selected “User parameter”
This widget highlights the top 5 locations/department/segment etc (based on the user parameter selected that is available as a drop down option at the top filter panel) with the highest engagement on the platform for a selected time period. Engagement is measured through various interaction types including reactions, feed posts and comments, replies, shares, and favorites. The "Total engagement" column provides a combined count for all interaction types for the selected user parameter.
Column descriptions
- User parameter: Location/Department/Segment etc. available as a drop down option at the top filter panel
- Reactions: Number of likes or emoticons made by users from the selected user parameter.
- Feed posts & content comments: Total posts and comments contributed.
- Replies: Direct replies to posts or comments by users.
- Shares: Number of times content was shared by users.
- Favorites: Content items marked as favorites by users.
- Total engagement: Sum of all above interactions for each selected user parameter.
Least engaged by selected “User parameter”
This widget highlights the bottom 5 locations/department/segment etc (based on the user parameter selected that is available as a drop down option at the top filter panel) with the lowest engagement on the platform for a selected time period. Engagement is measured through various interaction types including reactions, feed posts and comments, replies, shares, and favorites. The "Total engagement" column provides a combined count for all interaction types for the selected user parameter.
Column descriptions
- User parameter: Location/Department/Segment etc. available as a drop down option at the top filter panel
- Reactions: Number of likes or emoticons made by users from the selected user parameter
- Feed posts & content comments: Total posts and comments contributed
- Replies: Direct replies to posts or comments by users
- Shares: Number of times content was shared by users
- Favorites: Content items marked as favorites by users
- Total engagement: Sum of all above interactions for each selected user parameter
Social campaign shares
The "Social campaign shares" table provides a view of how many times active social campaigns are being shared across different social media platforms. This table enables quick visibility into share activity, the corresponding social media platforms and its respective contribution (in percentage) for all tracked campaigns.
Column descriptions
- Platform: The specific social platform where the campaign was shared (e.g., Twitter, Facebook, LinkedIn). Shows only platforms where campaigns were shared.
- Number of shares: The number of times the social campaign has been shared on the platform during the current reporting period.
- Share contribution (%) : Contribution of the of shares of active social campaigns on each platform as a percentage of the total shares across all platforms.
- E.g. LinkedIn contributes 26.4% of all the shares of active social campaigns
- Formula - 153/(153+90+336)
Comments
Please sign in to leave a comment.