Search dashboard overview
As part of the application-level analytics, the Search dashboard gives a comprehensive view of how users interact with your intranet's search functionality. It combines essential metrics with detailed charts and tables to help administrators and stakeholders monitor search engagement, identify opportunities for improvement, and troubleshoot issues with search relevance or usability.
Note:
The search dashboard measures the search activity by users even if the users are no longer on the platform. If they have performed a search activity in the past, their search activity is recorded and displayed as metrics basis the time period selected
Key components
Hero metrics: Displays high level metrics capturing a snapshot of the overall engagement around the Search feature
Total search volume
This metric measures the total number of search queries performed by all users who were/are registered users on the platform during the selected time period.
Search click through rate
This metric measures the percentage of total search queries that returned relevant results and that lead to a content view or click on a search result. It's shown as an absolute number and as a percentage of the total number of search queries that led to a click on a search result.
- Formula = (Number of search result clicks/number of search queries)*100
- 14/23 = 60% of total searches led to a click on a search result
A high click through rate signals search relevance. A low click through rate might signal action needed to make content easier to find for your users.
No results search
This metric measures the percentage of search queries that return zero results. It's shown as an absolute number and as a percentage of the total number of search queries that returned zero results/
- Formula = (Number of searches resulting in 0 results/Total number of searches)*100
- 4/23 = 18% of total searches returned zero results
Average number of searches per logged in user
This metric reflects the average search activity per user (irrespective of whether the user is registered on the platform or not anymore but has performed a search) during the selected time period.
- Formula = Average searches per user = Total search volume/Number of users for the defined period who performed a search
- 23/16 = 1.44
Search usage volume and click through rate dashboard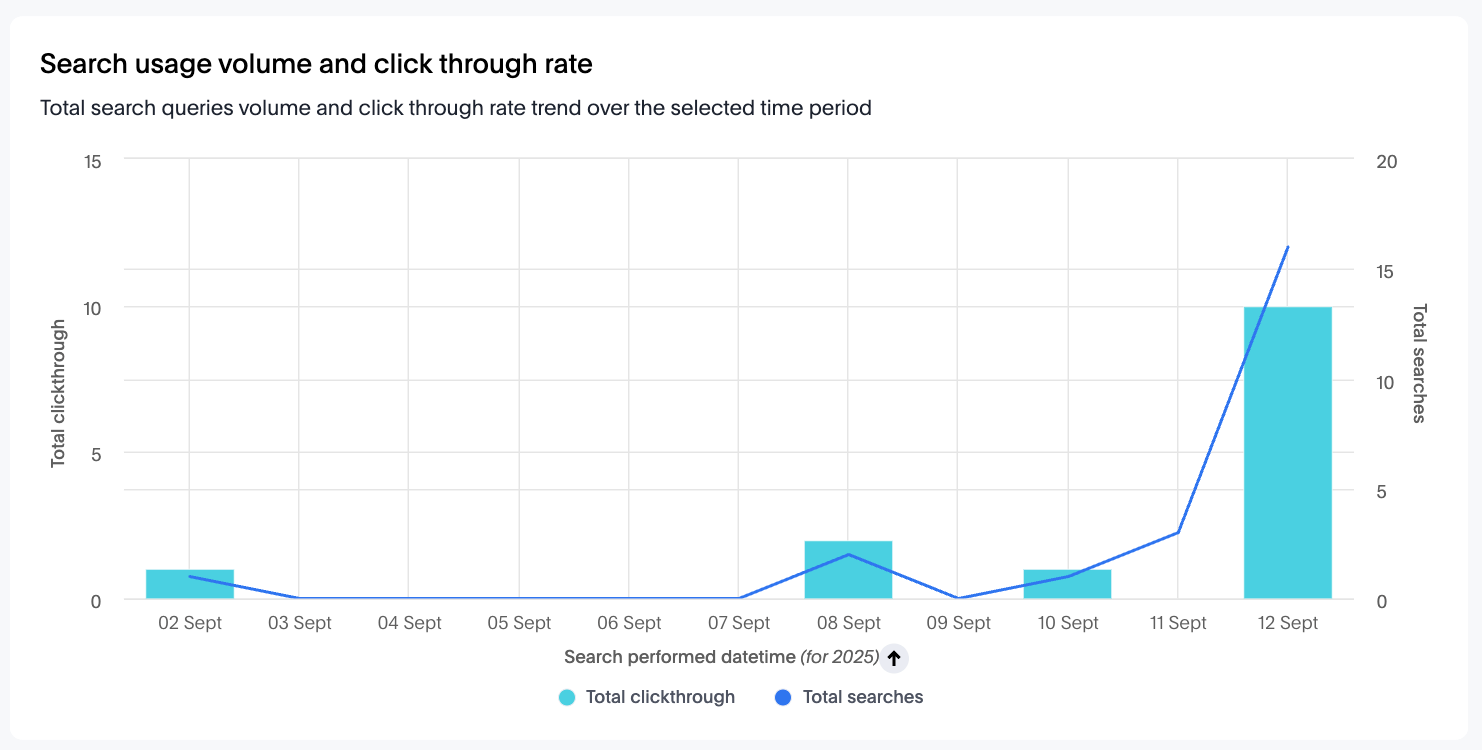
This chart visualizes the total number of search queries (search volume) and the total number of click throughs (searches resulting in a user clicking a result) over the selected time period by all users. The line represents the total searches, while the bars indicate click through counts for each day.
Note:
Detailed data can be downloaded as a CSV file through the Download button on the widget.
Insights and data interpretation
- Total searches: Track fluctuations in search activity to understand how often users are utilizing search functionality.
- Total click through: View how ma›ny searches led to interactions with results, providing insight into search effectiveness and user satisfaction.
- Trend analysis: Compare the lines and bars to identify days with high activity or anomalies where users searched but did not find relevant results.
Top search queries table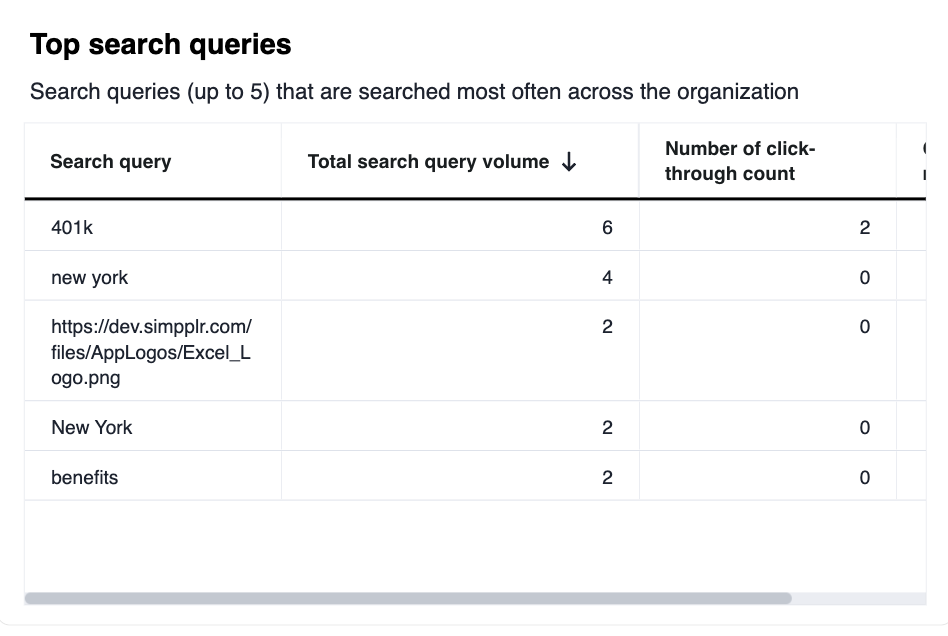
This table lists the search terms (up to 5) most frequently used by employees across the organization within the selected time period. It highlights not only volume, but also user behavior after the search—whether a result was clicked.
Column descriptions
- Search query: The term entered into the search bar by users
- Total search query volume: The number of times this term was searched
- Number of click through count: How many times users clicked on any result after performing the search for the corresponding search query
- Click through rate: The percentage of searches for the term that resulted in a click on a result, reflecting search result effectiveness
- Click through rate formula = Number of click through count/Total search query volume
Interpretation and data insights
- Identify trending and priority topics users are seeking information about.
- Diagnose where users are not finding what they need (queries with low or zero click through rates).
- Use the data to improve results for popular search terms and address information gaps in the intranet.
Most searches performed by selected user parameters: Location/Department/Segment etc.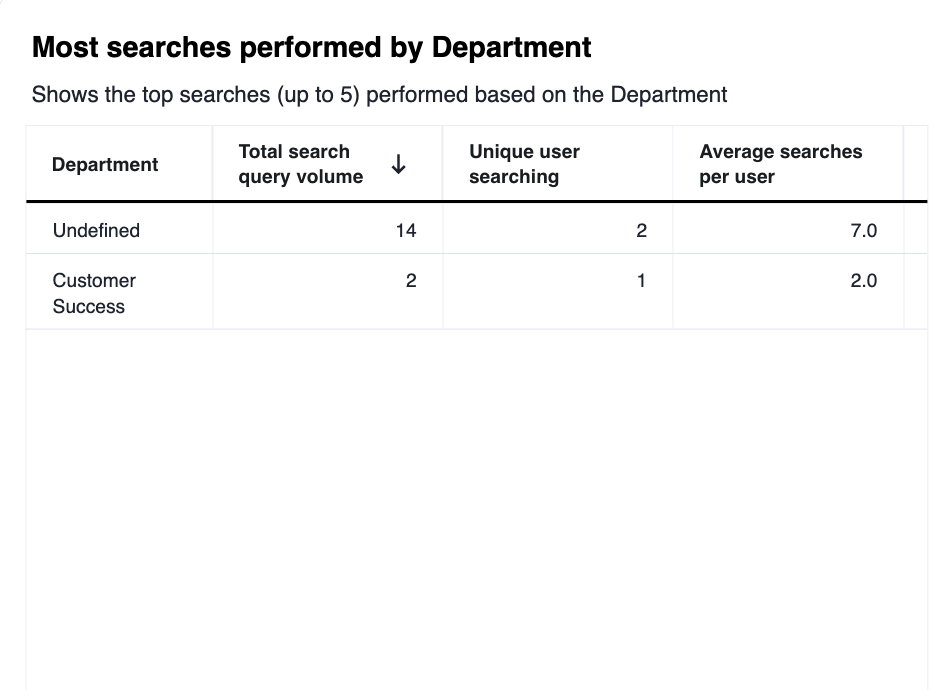
This table highlights the highest number of searches performed on the platform based on the selected user parameter (such as location, department, segment etc. available as a dropdown option to select at the top filter panel), displaying up to five top-performing locations/departments etc.
Column descriptions:
- User parameter: This can be a location/segment/department etc. available as a dropdown option at the top filter panel
- Total search query volume: The total number of searches performed by users in that “user parameter” during the selected time period
- Unique user searching: Number of individual users conducting searches from the selected “user parameter” during the time period
- Average searches per user: The mean number of searches performed by each user in the location during the selected time period
Interpretation and data insights
- Lists “user parameters”(location/department segment etc.) with high or low search activity to guide targeted support, training etc.
- Identify locations/department/segments etc where search is most actively used, signalling engaged users or potentially unmet information needs.
No result search queries table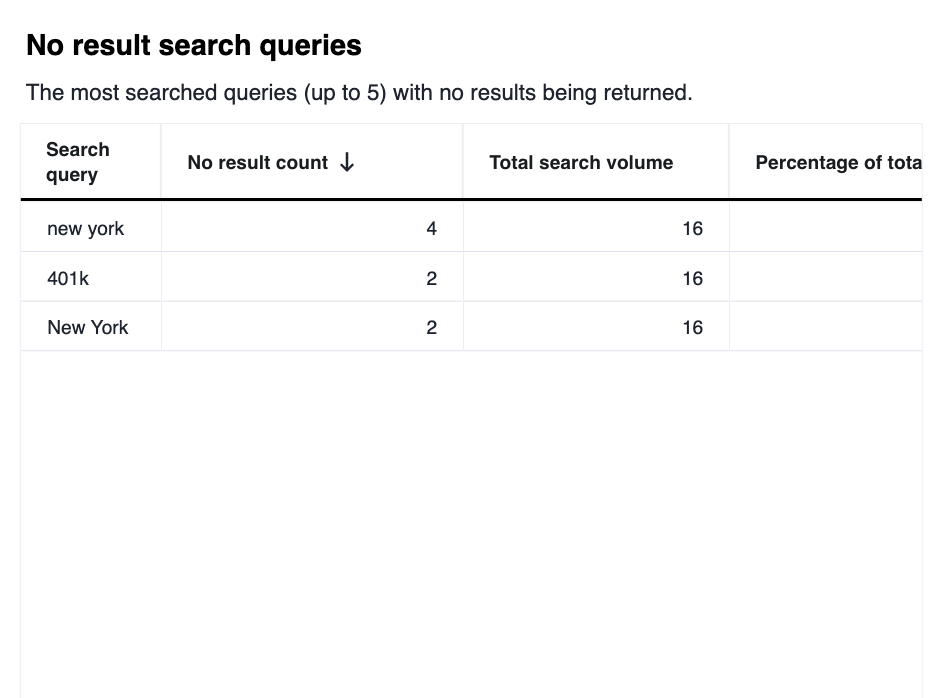
This table lists the most frequently searched terms (up to 5) that returned zero results during the selected time period. It highlights areas where users were unable to find relevant content through search.
Column descriptions:
- Search query: The exact term entered into the search bar.
- No result count: The number of times this search query produced no results.
- Total search volume: The total number of searches performed, providing context for the search's frequency.
- Percentage of total searches: The share of total searches that this no-result query represents.
Data Insights and Interpretation
- Identify gaps in the platform’s content or possible issues with search relevance.
- Use these insights to improve documentation, add missing resources, or optimize search indexing for more accurate results.
- Monitor recurring no-result queries to proactively address emerging user needs.
Top search queries with no click through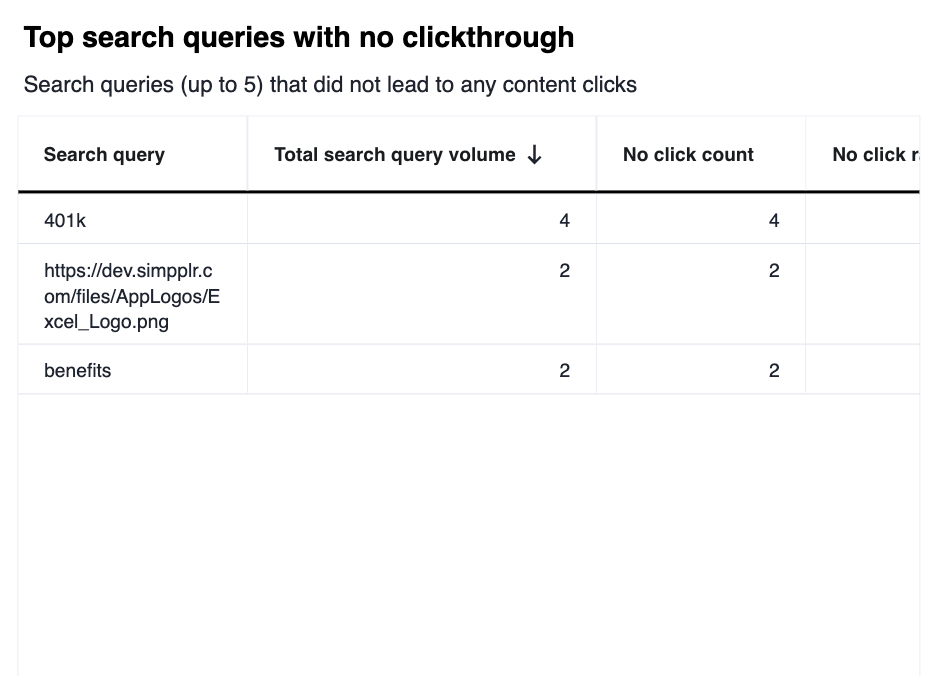
This table lists the search queries (up to five) that were most often entered by users but did not lead to any content clicks within the search results. It helps identify terms where users did not engage with the search output, despite searching.
Column descriptions:
- Search query: The actual search term entered by users.
- Total search query volume: The number of times the query was searched within the reporting period.
- No click count: How many searches for the term resulted in no clicks on any result.
- No click rate: The percentage of searches for the term that led to no clicks (higher values may indicate irrelevant or unhelpful search results).
- No click rate formula = No click count/Total search query volume
Data insights and interpretation
- Spot terms/queries where the search results are not meeting user expectations—even if results are shown, users do not find them useful enough to click.
- Use the insights to refine content relevance, improve search result quality, or address gaps in content for these queries.
Top click through types
This table displays the top content types users are accessing after performing a search, ranked by the number of clicks.
Column descriptions
- Type: The category or format of the content that users clicked on (e.g., Site, Content, People, Native Video)
- Total click through: The number of times users clicked on search results of this type
- Percentage of click through types: The share of all post-search clicks attributed to each content type
Insights and interpretation
Use insights to prioritize or promote content types that drive higher engagement. Analyze low-performing types to improve their relevance or representation in results.
Comments
Please sign in to leave a comment.